Morningstar calculates standard deviation for stocks and portfolios using the trailing monthly total returns for the appropriate time period. All of the monthly standard deviations are then annualized.
Two equations make up our current standard deviation calculation. The first part calculates the monthly standard deviation. The second part annualizes the monthly number to put it in a one-year context.
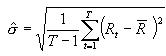
Monthly Standard Deviation
where
X1 = return for first month
Xi = return for the ith month (each month between the first and last month)
Xn = return for the last month
n = total number of returns being used, in this case 36.
 = average monthly total return during the 36-month period, also called the arithmetic mean. This number is arrived at by adding together all 36 monthly returns for the fund and dividing by 36.
Annualized Standard Deviation
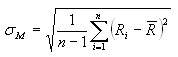
where
sM = Monthly standard deviation
Ri = Return of the portfolio in month i
n = Number of periods
 = Average monthly total return for the portfolio
 is also called the arithmetic mean, and it is calculated by adding together all the monthly returns for the portfolio and dividing by the number of months.

Morningstar annualizes the monthly standard deviation by multiplying it by the square root of 12.