The following variables relate to company earnings per share:
e1 = forecasted earnings per share (EPS) for the current fiscal year
e0 = EPS for the most recently reported fiscal year
e�1 = EPS for the fiscal year prior to e0
e�2 = EPS for the fiscal year prior to e�1
e�3 = EPS for the fiscal year prior to e�2
e�4 = EPS for the fiscal year prior to e�3
The same notation is used for book value per share, revenue per share, cash flow per share, and dividends per share except that �b,� �r,� �c� or �d,� respectively, are substituted for �e� in the example above.
There are two steps involved in the calculation: First calculate up to five prospective yields (e1/p, b1/p, r1/p, c1/p and d1/p: as many as are available) for each stock; second calculate a float-weighted percentile score (0-100) for each available yield factor for each stock within each scoring group.
As many as possible of e1/p, b1/p, r1/p, c1/p and d1/p are calculated for each stock. Because p is known, the method used to forecast e1, b1, etc. is key.
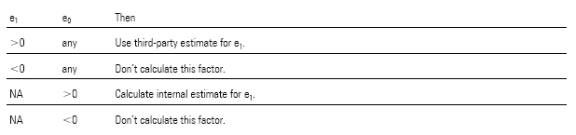
If a positive third-party forecast of e1, b1, r1, c1 or d1 is available, it is used to calculate the prospective yield. (At the time of writing, Morningstar only uses third-party forecasts for e1). If e1, b1, r1, c1 or d1 is forecasted to be negative by a third party, or if e0, b0, r0, c0 or d0 is negative and no third party forecast is available, prospective yield on that factor is excluded for that stock. If no third party forecast is available and e0, b0, r0, c0 or d0 is positive, then forecasted values are calculated. In summary, when:
Internal estimates for e1 are based on the following straightforward relationship between prospective and current EPS:

Because e0 is known, only the growth rate g(e1) must be calculated to provide a forecast of e1. The growth rate g(e1) is calculated from historical earnings data.
First calculate as many as possible of four periodic growth rates:
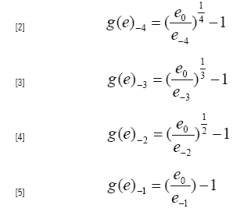
If e�1, e�2, e�3 or e�4 is negative, no periodic growth rate is calculated using that data point. A minimum of one periodic growth rate must be available to determine g(e1).
Because this growth rate is used to estimate the current year EPS, e0 must be positive and e0 serves as the numerator for calculating growth. This growth rate can sometimes be different than the historical earnings growth rate used to determine growth orientation, because that growth rate will use e�1 as the numerator when e0 is negative.
When all available growth rates have been calculated, average the results:

Prospective book value, revenue, cash flow, and dividend yields are calculated in the same way.
Thus,
Estimated earnings growth g(e1) and forecasted earnings e1 are calculated only for stocks where e0 is a positive number.
In calculating g(e1), recent growth rates are included in more of the averaged terms than are older growth rates; recent growth rates are therefore weighted more heavily than are older growth rates.
If only forecasted dividend yield, or no information, is available for a given stock, the stock is eliminated from the scoring group and is not scored in any way.
When one or more of e1/p, b1/p, r1/p and c1/p values have been calculated, with or without d1/p, each stock is assigned a float-weighted percentile score for each relevant factor. The percentile scores are calculated within each stock�s scoring group. (There are 21 scoring groups based on ea h combination of the seven style zones and three size groups(large, mid, or small).
To calculate an earnings yield score (0-100) for each stock in a scoring group:
1) Rank all stocks in the scoring group by e1/p yields in ascending order.
2) Determine the total float capitalization of all stocks in the group. Float is defined as the number of shares issued and outstanding, less any shares owned by insiders, 5% owners, and Rule 144 shares.
3) Starting with the lowest observations, trim all stocks that sum up to 5% of float. Then, trim 5% of the float from the highest observations. When a stock �straddles� the 5th percentile point or 95th percentile point, remove it from the sample.
4) Calculate the float-weighted average e1/p for the remaining stocks.
5) Add the trimmed stocks back to the sample. Calculate the ratio of each stock�s e1/p to the float-weighted average e1/p.
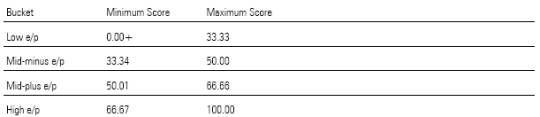
6) Assign each stock to an e/p �bucket� as follows:
a) If the stock�s e1/p is equal to or less than 0.75 times the float-weighted average e1/p (�the lower value cutoff�), the stock is assigned to the low e/p bucket.
b) Or, if the stock�s e1/p is equal to or less than the float-weighted average e1/p, the stock is assigned to the mid-minus e/p bucket.
c) Or, if the stock�s e1/p is equal to or less than 1.25 (�the upper value cutoff�) times the float-weighted average e1/p, the stock is assigned to the mid-plus e/p bucket.
d) Or, the stock is assigned to the high e/p bucket.
When each stock has been assigned to an e/p bucket, it is then scaled relative to other stocks in the same bucket. The low e/p bucket is used as an example here:
1) Order the stocks within the low e/p bucket by their raw e1/p scores, from lowest to highest.
2) Within the low e/p bucket, assign each stock a value equal to the cumulative float represented by that stock and all stocks with a lower e1/p. Thus, the stocks in the low e/p bucket have values ranging from 0.00+ (the stock with the lowest e1/p in the low e/p bucket) to 100 (the stock with the highest e1/p in the low e/p bucket).
3) Where two or more stocks have the same e1/p, they are assigned a value that represents the cumulative float of all stocks with a lower e1/p plus one-half of the total float of the stocks that share the same e1/p.
4) Re-scale the scores in the low e/p bucket between 0.00+ and 33.33.
Repeat the four steps immediately above for each of the mid-minus, mid-plus and high e/p buckets; and re-scale the values as follows:
All of the steps in this section are then repeated for each of b1/p, r1/p, c1/p and d1/p. For stocks that do not pay dividends, 0% dividend yield is considered a valid data point and is given a dividend yield score.
Repeat all of the steps above for each scoring group.
Percentile scores for micro-cap stocks are assigned based on the small-cap scoring group for the respective style zone. For each micro-cap stock, find the small-cap stock that has the closest earnings yield. Copy the percentile score from the small-cap reference stock and assign it to the micro-cap stock. Repeat for all the remaining value factors.
LT Earnings Growth Factor, Hist Earnings Growth Factor, Book-Value Growth Factor, Sales Growth Factor, Cash-Flow Growth Factor
These are the five growth factors used to calculate the overall growth scores of the stocks and funds. The numbers range from 0 to 100. The lower the scores, less growth-oriented the stocks and the funds are, the higher the scores, the more growth-oriented the stocks and funds are.
Calculation:
There are two steps involved in the calculation: First calculate up to four average growth rates g(e), g(b), g(r) and g(c) for each stock, using the process described in the next section. Collect third-party estimates for long-term projected earnings growth rate, g(e5). Second Calculate a float-weighted percentile score (0-100) for each available growth rate for each stock within each scoring group.
As many as possible of g(e), g(b), g(r) and g(c) are calculated for each stock. The example historical growth rate calculation below uses g(e), but the process is identical for g(b), g(r) and g(c). In addition, if g(e5) is available from a third party and if the estimate is greater than 0, it is used as a fifth growth rate indicator. If e0 and e�1 are both negative, then g(e) is not calculated. If e0 or e�1 is positive, then g(e) is calculated as follows. First calculate as many as possible of four periodic growth rates:
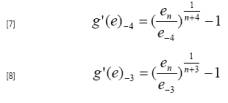
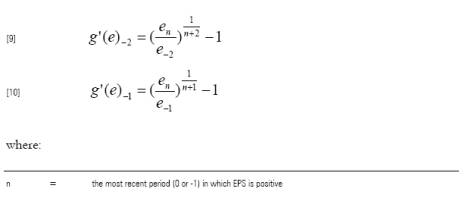
If e�1, e�2, e�3 or e�4 is negative, no periodic growth rate is calculated using that data point. A minimum of two periodic growth rates must be available to determine g(e). If n=0, up to four rates are calculated; and if n= -1, up to three growth rates are calculated.
When all available growth rates have been calculated, average the results:

If n=0 and if the stock was missing a third party forecast for e1, g(e) will be the same as the growth rate used in the calculation of the stock�s value orientation, g(e1).
Book value, revenue, and cash flow growth rates are calculated in the same way.
If growth information for at least one factor is unavailable for a given stock, the stock is eliminated from the scoring group and is not scored in any way.
As with the value factors, percentile scores are assigned to each of the five growth factors. The percentile scores are calculated within each stock�s scoring group. (There are 21 scoring groups based on ea h combination of the seven style zones and three size groups (large, mid, or small)).
To calculate an earnings growth rate score (0-100) for each stock within a scoring group:
1) Rank all stocks in the scoring group by their g(e) growth rates in ascending order.
2) Determine the total float capitalization of all stocks in the group.
3) Starting with the lowest observations, trim all stocks that sum up to 5% of float. Then, trim 5% of the float from the highest observations. When a stock �straddles� the 5th percentile point or 95th percentile point, remove it from the sample.
4) Calculate the share-weighted average growth rate for the remaining stocks. See Appendix A for a description of the share-weighted average.
5) Add the trimmed stocks back to the sample. Calculate the ratio of each stock�s g(e) to the share-weighted average g(e).
6) Assign each stock to a g(e) �bucket� as follows:
a) If the stock�s g(e) is equal to or less that 0.75 times the share-weighted average g(e) (�the lower growth cutoff�), the stock is assigned to the low g(e) bucket.
b) Or, if the stock�s g(e) is equal to or less than the share-weighted average g(e), the stock is assigned to the mid-minus g(e) bucket.
c) Or, if the stock�s g(e) is equal to or less than 1.25 times the share-weighted average g(e) (�the upper growth cutoff�), the stock is assigned to the mid-plus bucket.
d) Or, the stock is assigned to the high g(e) bucket.
When each stock has been assigned to a g(e) bucket, it is then scaled relative to other stocks in the same bucket. The low g(e) bucket is used as an example here:
1) Order the stocks within each bucket by raw g(e) score, from lowest to highest.
2) Within the low g(e) bucket, assign each stock a value equal to the cumulative float represented by that stock and all stocks with a lower g(e). Thus, the stocks in the low g(e) bucket have values ranging from 0.00+ (the stock with the lowest g(e) in the low g(e) bucket) to 100 (the stock with the highest g(e) in the low g(e) bucket).
3) Where two or more stocks have the same g(e), they are assigned a value which represents the cumulative float of all stocks with a lower g(e), plus one-half of the total float of the stocks that share the same g(e).
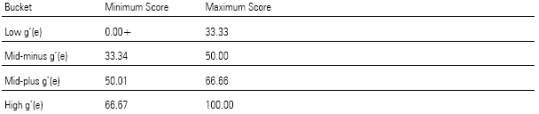
4) Re-scale the scores in the low g(e) bucket between 0.00+ and 33.33.
Repeat the four steps immediately above for each of the mid-minus, mid-plus and high g(e) buckets; and re-scale the values as follows:
All of the steps in this section are then repeated for the other four growth orientation factors. Repeat all of the steps above for each scoring group.
Percentile scores for micro-cap stocks are assigned based on the small-cap scoring group for the respective style zone. The procedure is described in the section on value factor scores.