-
Select the most appropriate benchmarks and peer group for the subject investment.
-
Hone time horizons to add precision to your analysis.
-
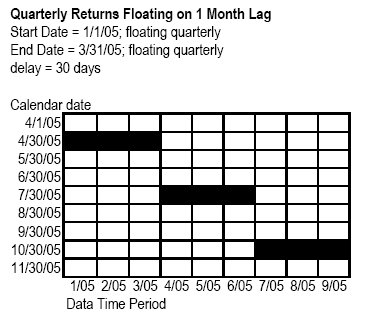
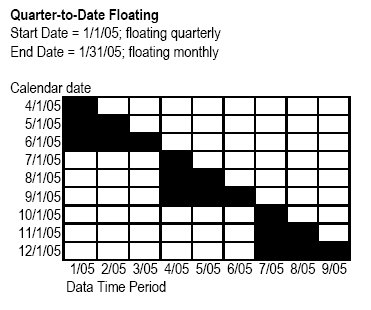
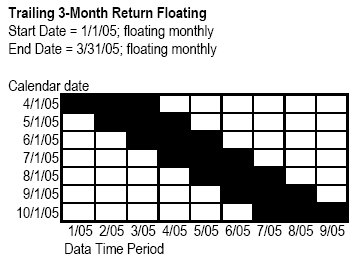
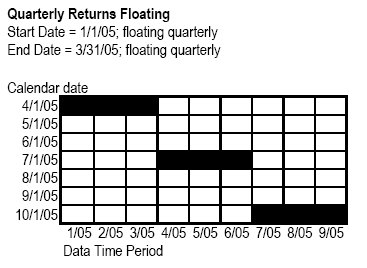
Select to float start and end dates of the report to have it update automatically with the freshest data. You can float either date on a monthly, quarterly, semiannually, or yearly basis and also build lag time into the calculation. See below for some examples of how to create floating data points.
Trailing 3-Month Return Floating
Quarterly Returns Floating on 1 Month Lag