The holdings-based style consistency tool allows a user to see the historical movement of a portfolio in terms of equity style, fixed-income style, sector, and asset allocation. This helps clearly describe the management of a portfolio over time and defines the consistency of that management.
To create a new Holdings-Based Style Consistency report: on the New menu, point to Reports, and then choose HB Style Consistency.
Illustrate style and holdings characteristics over time to evaluate style drift.
Plot Investments with appropriate benchmarks.
By accessing the history of your product both visually and in the X and Y scores, the tool can help explain why an investment is in a particular Morningstar Category and give direction for what might be done going forward to either stay in, or move to a given category.
Illustrate fixed income style trails in addition to equity style trails.
4Style and Sector Trails Section
Illustrate the historical evolution of an investment�s equity style, fixed-income style and sector allocation over time. Each dot represents the centroid for a given portfolio. The centroid is the weighted average of the size/value-growth (or credit/duration for fixed income) scores of the underlying holdings of the portfolio. (Please refer to Morningstar Style Box methodology paper for more detail.) The size of the dot represents the portfolio date; the smallest dot indicates the earliest portfolio within the time period.
Illustrates an investment�s exposure to the Morningstar Super Sectors over time relative to a benchmark. The default benchmark is the Standard & Poor's 500, which is represented by the small solid triangle centered in the middle of the sector delta illustration. The secondary benchmark is the Russell 2000 index, which is shown as a circular investment trail. The subject investment and secondary benchmark are scaled relative to the first benchmark in the display.
Evaluates statistics for the subject portfolio and a user-defined benchmark. The value-growth and size scores are displayed for both the most recent portfolio and an average of three years of history. The style or size drift displays the standard deviation of the value-growth or size coordinates of the historical centroids. Overall drift measures how much the style has drifted over time and incorporates both value-growth and size factors, calculated by taking the square root of the sum of squared value-growth and size scores. The drift scores for an investment are compared to the benchmark to provide context.
Graphs illustrate the breakdown of the subject portfolio over the selected time period in terms of style, sector and asset allocation. The data tables on the right provide numerical measures of the breakdowns for both the most recent portfolio and an average for the time period selected.
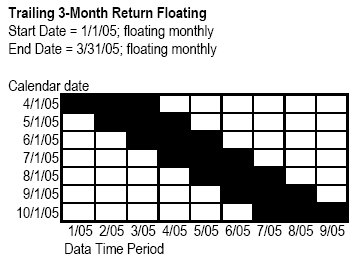
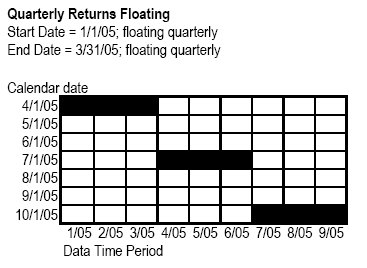
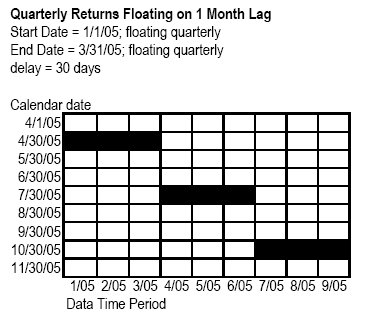
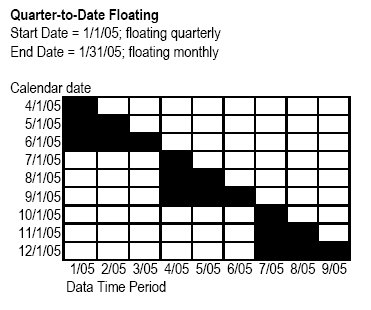
You can float the start and end dates for your analysis on a monthly, quarterly, semiannually, or yearly basis and also build lag time into the calculation. See below for some examples of how to create floating data points.
Trailing 3-Month Return Floating
Quarterly Returns Floating on 1 Month Lag
Morningstar Style Box Press Release, Fact Sheet, Research Paper
Morningstar Sectors Press Release, Fact Sheet, Research Paper