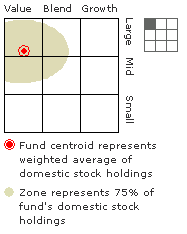

Traditionally, Morningstar has used the Equity Style Box to classify funds based on their underlying holdings. However, to offer a more complete picture of how the fund’s holdings are distributed, Morningstar has developed Ownership Zones.
Ownership Zones are the shaded area of the Style Box, intended to be a visual measure of a fund's style scope - that is, the primary area of ownership on the Style Box. Some key points:
Ownership Zones for Funds
The style and size scores for stocks and funds are the building blocks for the Morningstar Ownership ZoneSM. A fund's Ownership Zone is derived by plotting each stock in the fund's portfolio within the proprietary Morningstar Style Box. The shaded area represents the center 75% of the fund's assets, and it provides an intuitive visual representation of the area of the market in which the fund invests. A "centroid" plot in the middle of the Ownership Zone represents the weighted average of all the fund's holdings.

Calculating the Centroid
The fund centroid, appearing in the center of the Ownership Zone, represents the weighted average of all the fund’s holdings. The centroid’s position is used to assign a fund to one of the nine Style Box categories.
A fund's size (its y or vertical placement) is determined by calculating the asset-weighted size score of the size scores. Likewise, a fund's style (x or horizontal placement) is determined by calculating the asset-weighted average of the stocks’ net value/growth scores.
The plot of the resulting style and size score on the Style Box grid is called the centroid. Here's the calculation for x and y (same for both):
y = sum(yi*wi)
Where:
yi= size score for ith stock
wi = style score for ith stock.
Ownership Zones for Portfolios
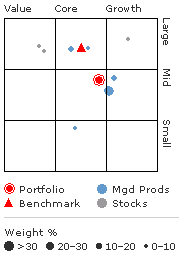
For portfolios, Ownership Zones provide a quick visual representation of a portfolio's style as a whole, as well as a picture of how diversified the underlying holdings of the portfolio are across styles.

The portfolio centroid represents the weighted average of all the underlying holdings in a portfolio. In the above picture, the overall portfolio style is mid-cap blend.
Each holding in the portfolio is represented by a different dot in the Ownership Zone graphic, blue for managed products, gray for stocks. The size variations of the dots give you a quick idea of how much weight the holding takes up in the portfolio as a whole.
Using the Ownership Zone
Observing where the Ownership Zone falls within the Equity Style box is useful because many funds which appear similar in size and style may actually include quite different security types. For example, it’s expected that a fund holding mainly large-cap growth stocks would behave differently than one containing both large-and mid-cap value stocks, yet both funds might be classified as large-cap growth.
Over a period of time, the shape and location of a fund’s or portfolio's Ownership Zone varies. This movement is a good indicator of how consistent a fund’s style is.