The Returns-Based Style Trail chart uses the historical performance of a subject portfolio to calculate and display the history of style drift. You are able to change the style indexes, several calculation parameters, investment color and other investment settings to meet your needs.
To create a new Returns-Based Style Trail: on the New menu, point to Charts, and then choose RB Style Trail.
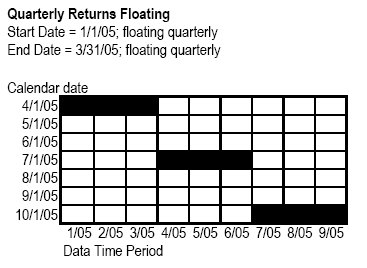
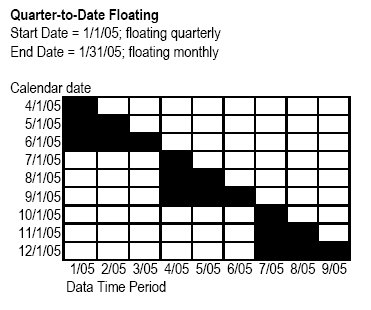
To change the Title, Start date, End date, Rolling window, Confidence region, Currency, and Constraints. Start date and End date set the time period for the analysis. By default End date is set to the most recent month-end, and the Start date is set to End date minus 60 months. You can float either date on a monthly, quarterly, semiannually, or yearly basis and also build lag time into the calculation. See below for some examples of how to create floating data points.
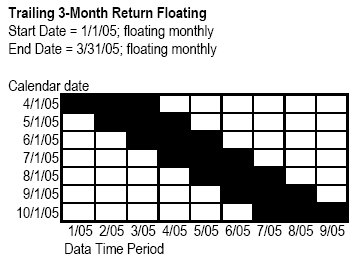
Trailing 3-Month Return Floating
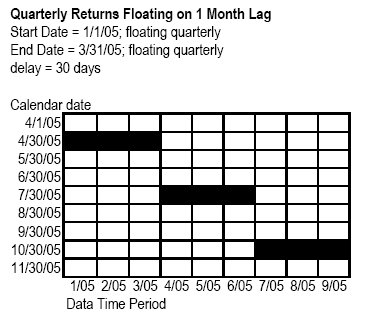
Quarterly Returns Floating on 1 Month Lag
Rolling Window sets the time period for each RBSA calculation within your analysis start and end date.
The constraints area allows you to manipulate the constraints place on the RBSA. Include long only forces all results to be > 0. You cannot change this amount. Include long & short allows results to be less than 0. For instance, 50% shorting places the lower boundary at �50 instead of 0. For this selection, you will be able to enter a value in the text box.
To change each investment's color and show or hide the confidence region. Edit multiple investments at the same time by selecting the investments, and then changing the appropriate settings.
To change the style indexes. You can use standard style indexes or pick your own. To select a standard set of style indexes, select a standard set from the Style Indexes drop-down menu. To create a custom set of style indexes, you need to indicate how many indexes you would like to plot (x) and then choose the indexes which are known as factors using the Edit button. The indexes you add beyond the number that will be plotted are included in the calculation, but the first x factors are plotted on the chart. In the Display drop-down, find the following choices for plotting: 4-Index Square, 6-Index Square, or 9-Index Square.
4Morningstar 4 plus (default)
Morningstar Large Value, Morningstar Large Growth, Morningstar Small Value, Morningstar Small Growth, 90-Day T-Bills
Morningstar Large Value, Morningstar Large Growth, Morningstar Mid Value, Morningstar Mid Growth, Morningstar Small Value, Morningstar Small Growth, 90-Day T-Bills
Morningstar Large Value, Morningstar Large Core, Morningstar Large Growth, Morningstar Mid Value, Morningstar Mid Core, Morningstar Mid Growth, Morningstar Small Value, Morningstar Small Core, Morningstar Small Growth, 90-Day T-Bills
Russell Top 200 Growth, Russell Top 200 Value, Russell 2000 Growth, Russell 2000 Value, 90-Day T-Bills
Russell Top 200 Value, Russell Top 200 Growth, Russell MidCap Value, Russell MidCap Growth, Russell 2000 Value, Russell 2000 Growth, 90-Day T-Bills
Wilshire Large Value, Wilshire Large Growth, Wilshire Mid Value, Wilshire Mid Growth, Wilshire Small Value, Wilshire Small Growth, 90-Day T-Bills
Morningstar Large Value, Morningstar Large Growth, Morningstar Small Value, Morningstar Small Growth, Lehman Brothers Aggregate Bond, 90-Day T-Bills
MSCI AC Americas ID, MSCI AC Europe ID, MSCI AC Far East ex Japan, MSCI Far East Japan, 90-day T-Bill
Holdings-Based and Returns-Based Style Models Paul D. Kaplan, Ph.D., CFA | 06-2003
Estimating Portfolio Style John Rekanthaler, Michele Gambera, Joshua Charlson